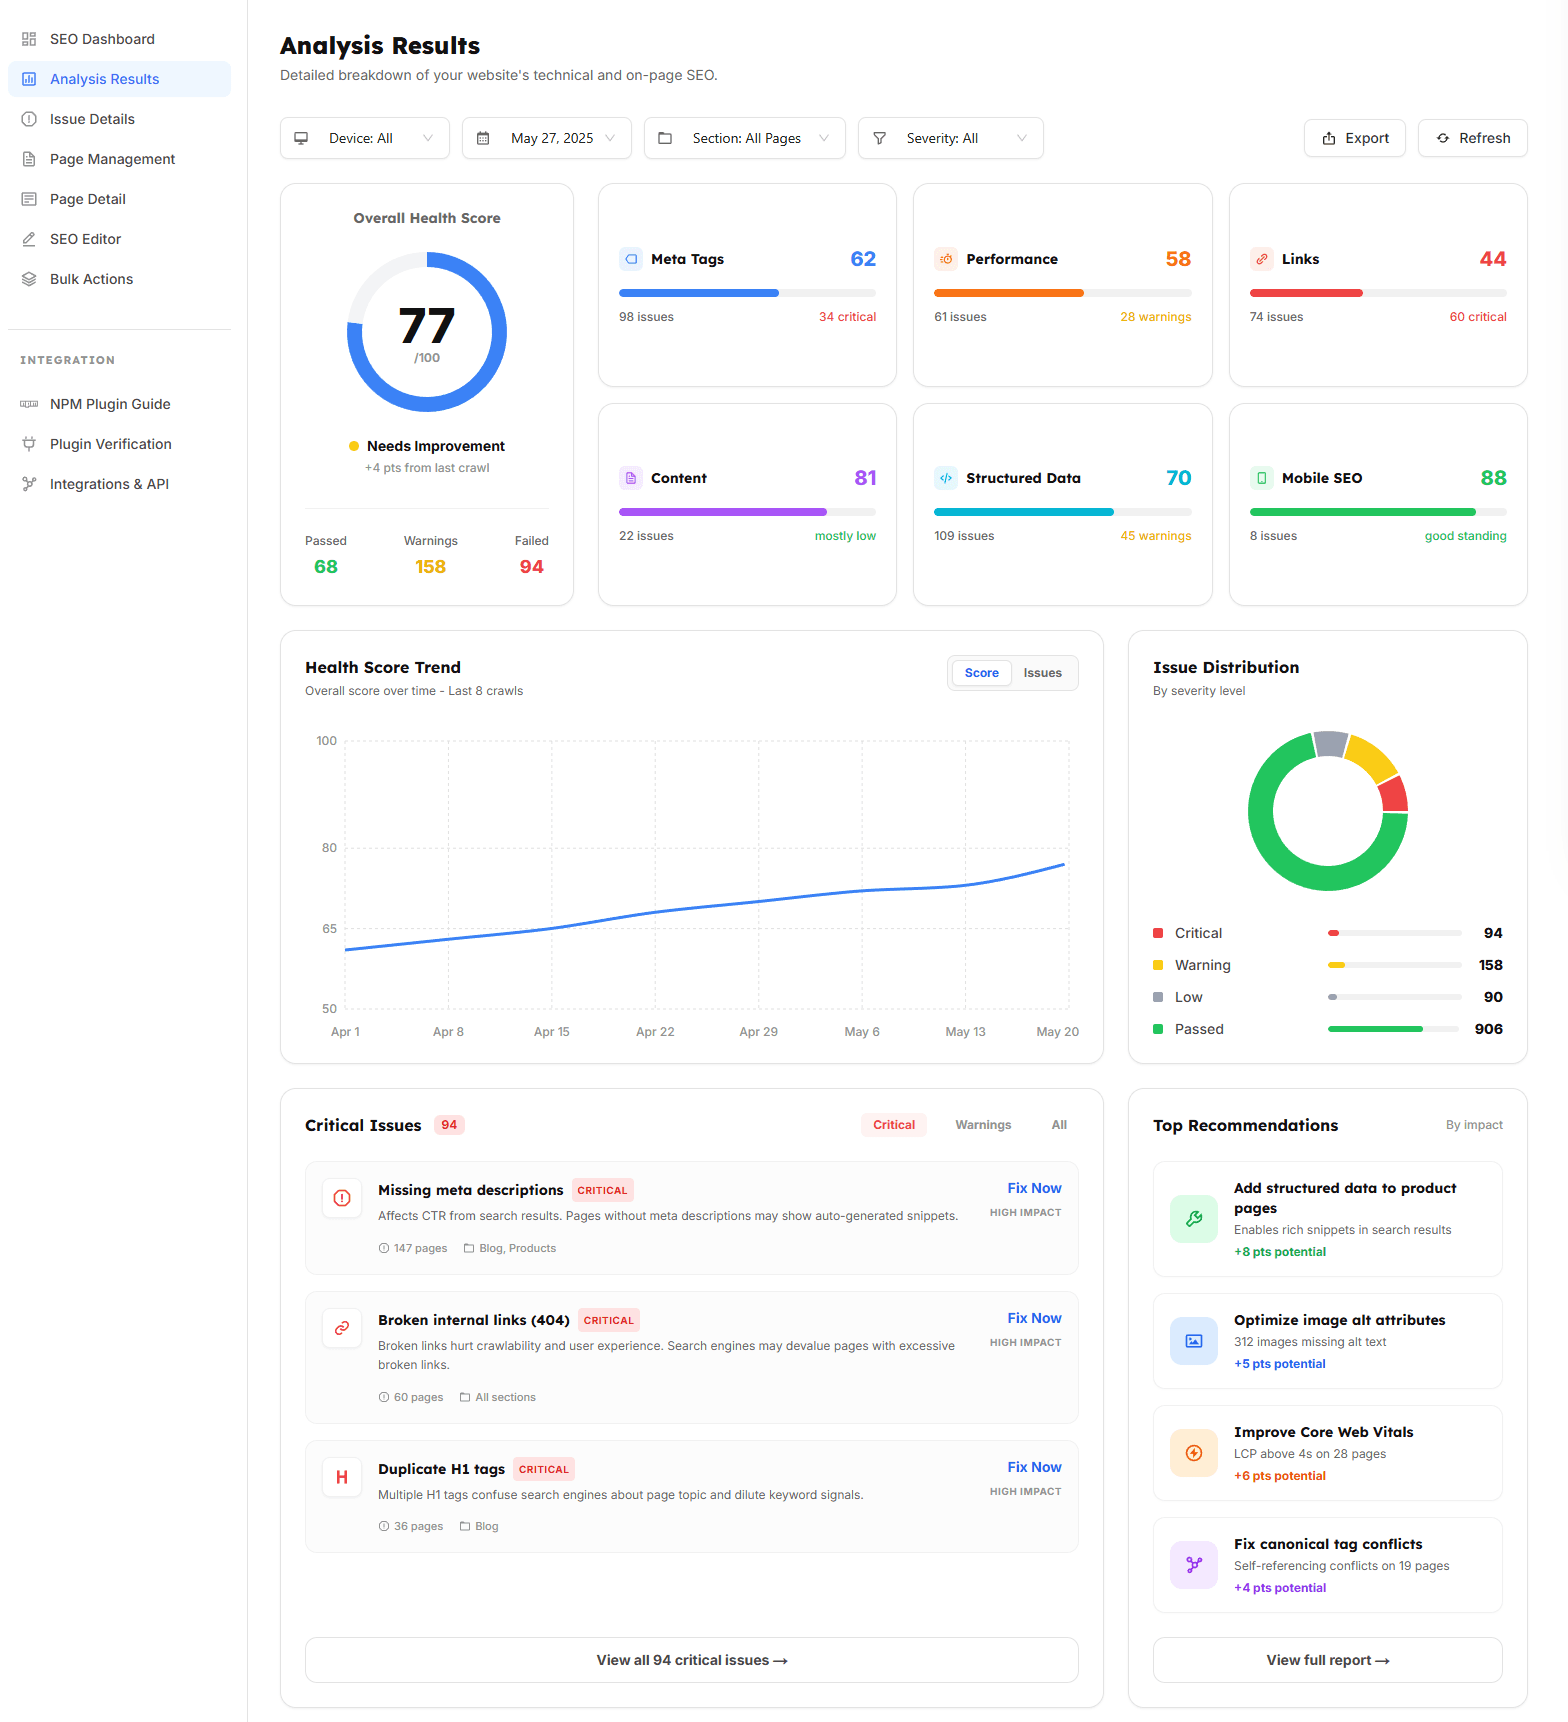
Analytics Dashboard – SaaS Metrics & Growth Intelligence
An intelligent SaaS analytics suite providing churn prediction, MRR breakdown, cohort retention matrices, and automated executive email reports.
Lead Full Stack
4–8 Weeks
Next.js & APIs
The Challenge
SaaS founders needed actionable insight into customer churn and expansion revenue without building costly custom internal analytics tools.
The Solution
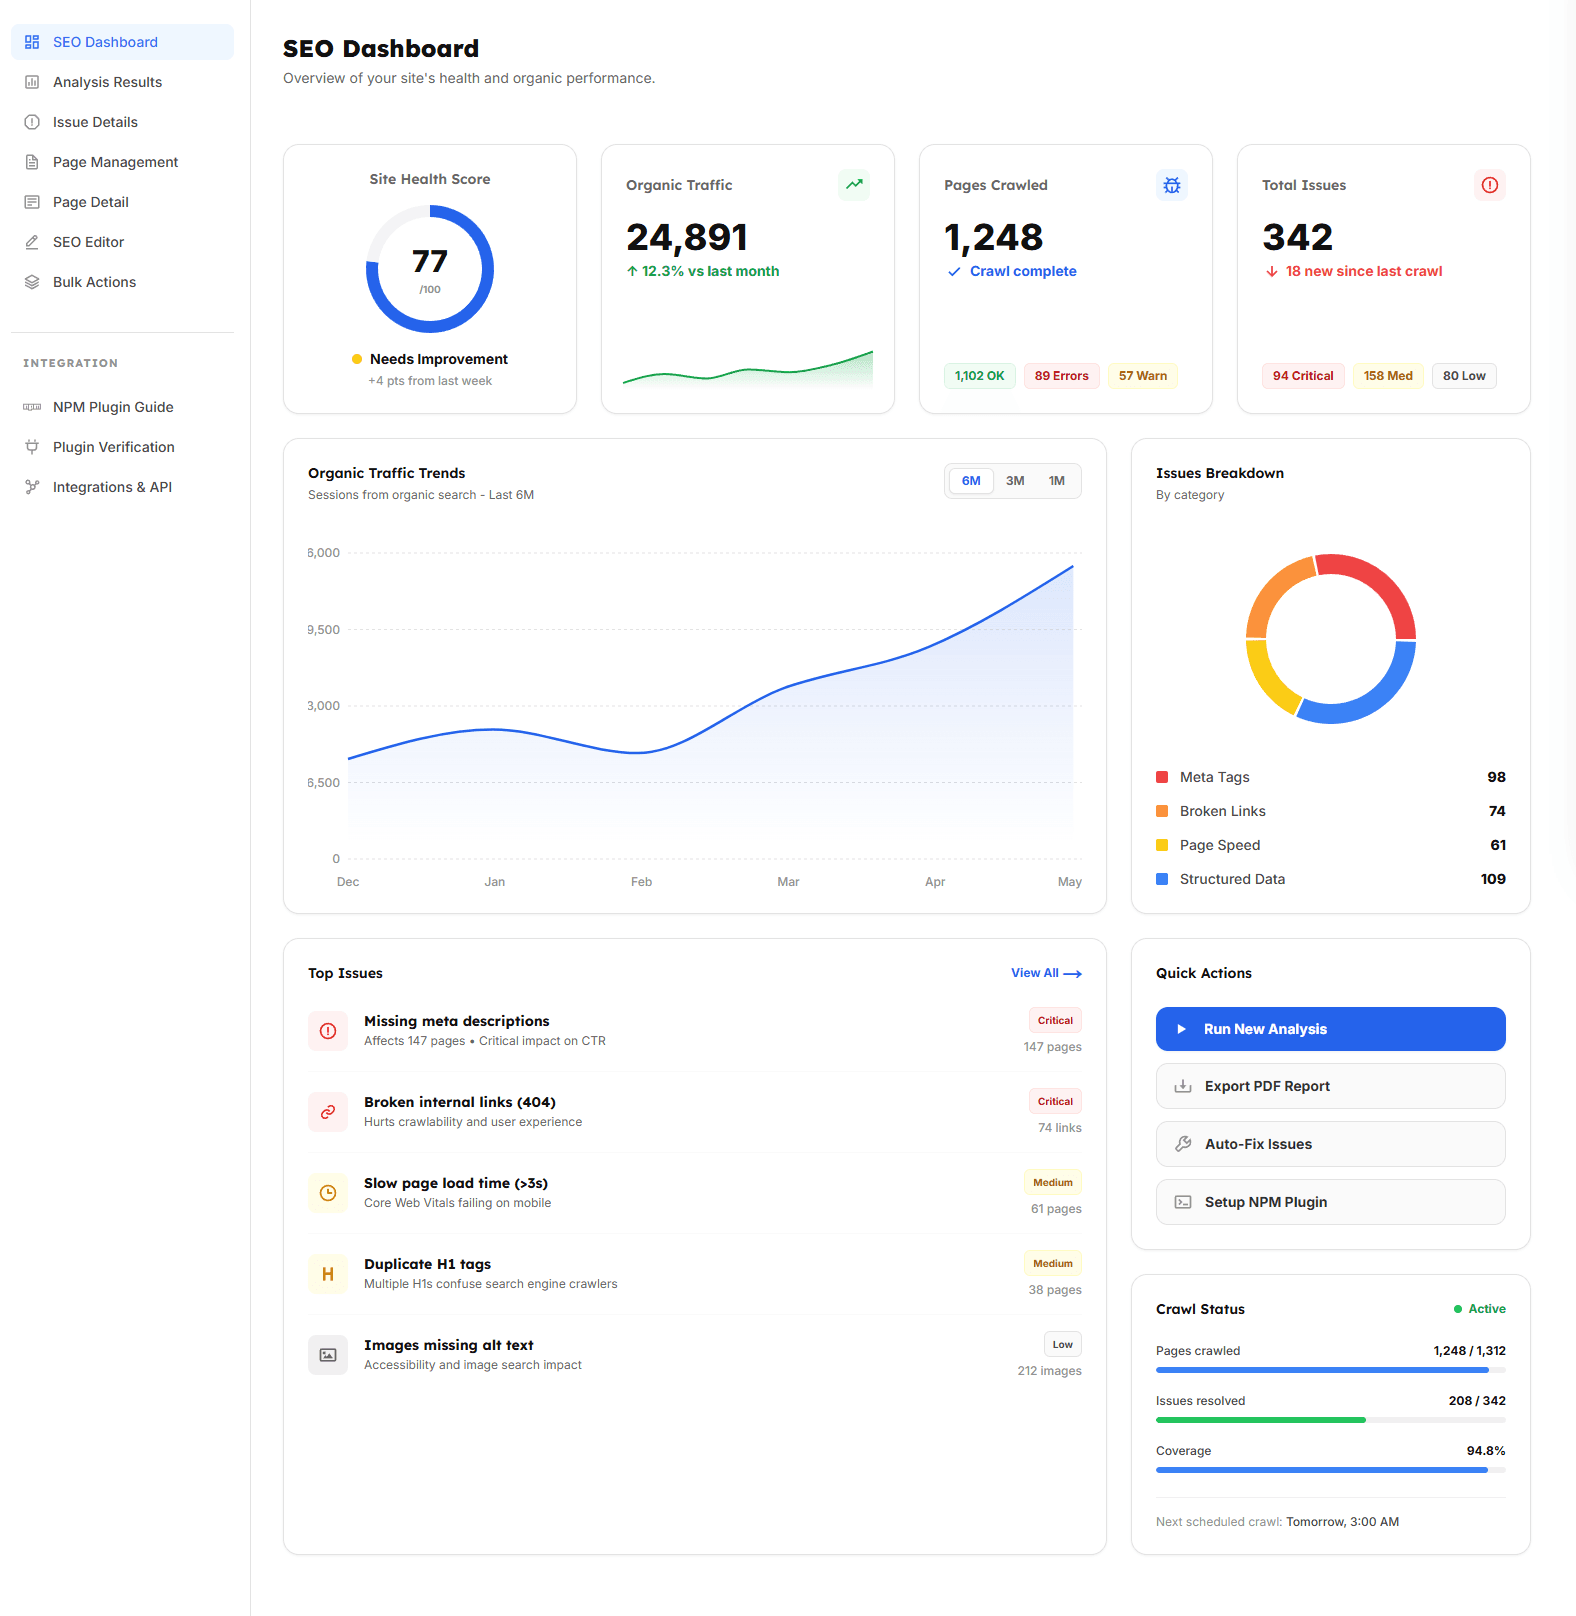
Created a modular analytics dashboard using React, Recharts, and Node.js with automated data synchronization from Stripe, Segment, and PostgreSQL.
Key Features Delivered
Engineered from scratch with clean code, scalable architecture, and strict attention to performance.
Cohort Retention Analysis
Visual retention heatmaps showing user engagement decay curves over weekly and monthly intervals.
Revenue Waterfall Breakdown
Interactive MRR bridges depicting new, expansion, contraction, and churned recurring revenue.
Automated Report Dispatch
Scheduled PDF and Slack digests delivered to stakeholders every Monday morning.
The Business Impact
Empowered founders and product managers with real-time visibility into customer unit economics.